

Buying Stages help you understand where accounts are in their buying journey based on engagement signals.
While Company Scoring determines overall account quality, Buying Stages focus specifically on timing and progression — showing how accounts move from early awareness to active evaluation.
Buying Stages are designed to support:
- TAM progression reporting
- Marketing impact reporting
- Identifying net-new accounts actively researching solutions
How it works
Buying Stages are determined by two systems that run in parallel for every account:
- Point-based scoring — Each active signal earns points toward a stage. Points are normalized by company size, and thresholds determine which stage the account reaches.
- Minimum Stage mapping — Signals can be directly mapped to a guaranteed minimum stage, meaning the account will appear at least at that stage as long as the signal is active.
An account's final Buying Stage is whichever result is higher between the two systems.
Buying Stages and Company Scoring are calculated independently. A company with a high Fit Score (A or B grade) may still be Unengaged in Buying Stages — and a C-grade company can be in Decision. Grade reflects ICP fit; stage reflects current buying activity.
Within ICP & Scoring → Scoring tab, you can configure which signals are:
- Enabled for Buying Stages
- Assigned to a Minimum Stage
- Set with a Days Until Cold decay value (for eligible signals)
Using Both: Buying stage and Account Score
Buying Stages are most powerful when combined with Account Score.
Priority by Fit Score + Buying Stage
- A/B + Decision → Top priority. Contact immediately.
- A/B + Awareness/Interest → High value, still early. Nurture with educational content.
- C/D + Decision → In-market, but not a great fit. Light-touch or self-serve motion.
- D + Awareness/Interest/Consideration → Deprioritize for now.
Use Cases
Configuring Buying Stages
For Buying Stages to work well, the following signals should be activated and correctly scored before going live:
- Website visitors configured for specific pages
- Intent signals configured
- First-party data connected, including:
- Event attendance
- CRM campaigns (if used)
- Marketing engagement (email sent/opened/clicked, web form fills, events)
- SEP engagement (email opened/replied/clicked)
Without these signals, there is limited data to map accounts accurately through the funnel. In addition to activating them, make sure each signal's point score is high enough to move accounts through the stages.
Whenever possible, we will set the default score and mapping accordingly but in many cases, it will need to be done manually (i.e. specific intent, website visitors, 1st party signals).
To setup Buying Stages:
- Navigate to the ICP & Scoring tab
- Select the Scoring tab
- Click into any signal chip → toggle Used for Buying Stages ON → select a stage from the Minimum Stage dropdown
- Optionally, set a Days Until Cold value for eligible time-based signals

📝 Changes to signal mappings take up to 24 hours to appear in the product.
Cheat Sheet for Mapping Signals
Here is a more comprehensive sheet showing which signals should map to which buying stage (recommended settings).
Where to Find Reports
Buying Stages surface in two places in UserGems:
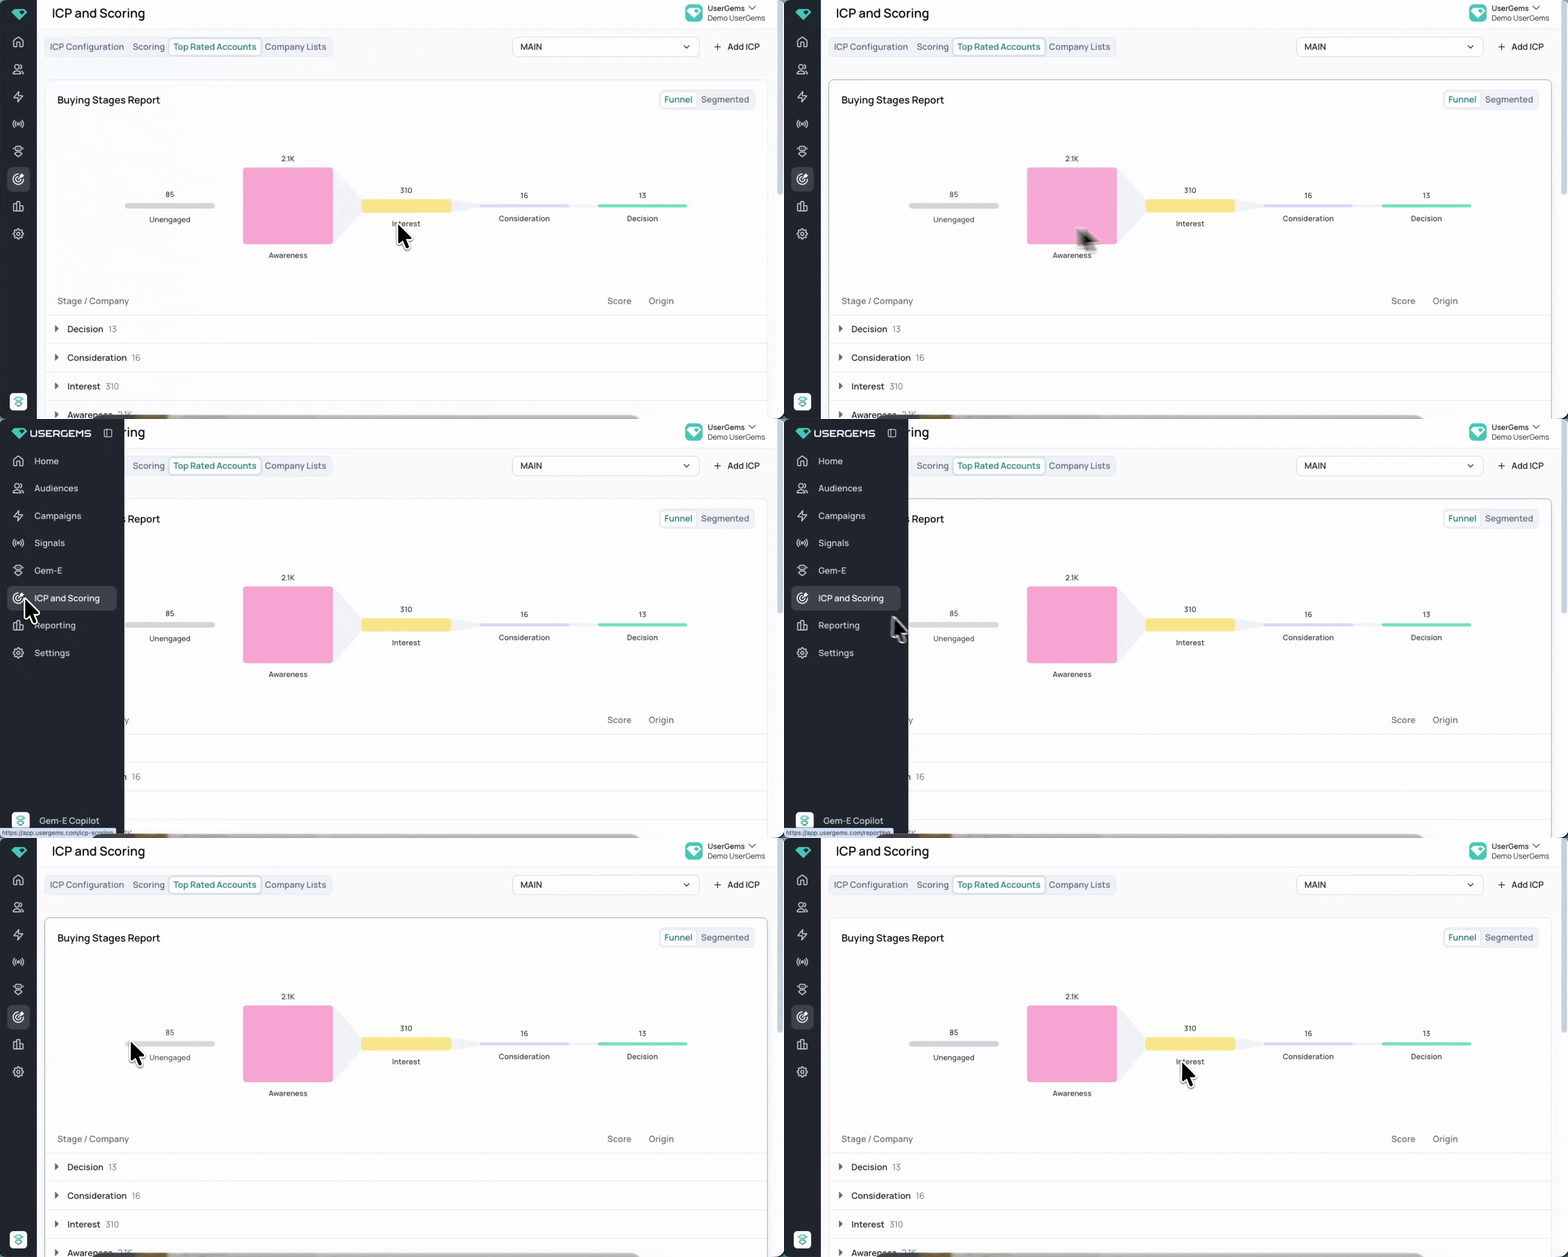
ICP & Scoring → Top Rated Accounts tab
Shows Buying Stages for accounts within a specific ICP. You can filter by ICP or audience segment to view stage distribution for a defined subset of your TAM.
Reporting page
Shows Buying Stages across your full TAM, combining all ICPs. Stage counts here reflect total coverage across every configured ICP.

ICP-level filtering is only available in the Top Rated Accounts view. The Reporting tab always shows your full TAM — you cannot filter by a single ICP or segment from that view.
The Five Buying Stages
Accounts are categorized into one of five stages. At any given time, an account is assigned to the highest stage triggered by its active signals.
1. Unengaged
No active buying signals. Account is in your TAM but has not shown engagement behavior that maps to any stage.
2. Awareness
Early problem- or competitor-awareness signals, such as:
- Third-party intent signals on relevant or competitive topics
- Competitive intent research
- Early outreach response
3. Interest
Offsite signals suggesting active investigation, such as:
- Past champion joins a target account (contact-level signal)
- Revive closed lost signal triggered
- Ad engagement (clicks)
- Email engagement (opens, replies)
4. Consideration
Onsite engagement signals, such as:
- Registered for an event (did not attend)
- Downloaded content from your site
- Interacted with chatbot or live chat
5. Decision
High-intent onsite activity, such as:
- Visited high-value pages (Demo Request, Pricing, Interactive Demo)
- Attended an in-person or virtual event
- Had a live meeting or interaction with your team
📝 Custom stage names and additional stages are not supported at this time.
How Signals Map to Stages
Each signal can be mapped to a Minimum Stage.

If an account triggers a signal mapped to a minimum stage, it will move to at least that stage. This is System 2 of the two-system calculation — it guarantees a floor, not a ceiling.
What are the thresholds for buying stages based on points?
The point accumulation system automatically maps accounts into the following stages based on their normalized score:
- Unengaged: Score of 0 or less.
- Awareness: 0-40
- Interest: 41-60
- Consideration: 61-80
- Decision: 80+
If the account's point-based score (System 1) produces a higher stage than the Minimum Stage mapping, the point-based result wins.
Example:
- An intent signal mapped to Interest moves the account to at least Interest.
- A demo request mapped to Decision moves the account to at least Decision.
- If both signals are active, the account will appear in Decision.
Signal mapping is fully configurable in the Scoring settings.
Signal Decay: Keeping Stages Current
Buying Stages reflect current engagement, not historical activity.
Each eligible signal includes a Days Until Cold setting.
Example: A "Product Announcement" signal configured with Days Until Cold: 20 days will contribute to stage mapping for 20 days. As time passes, the signal's impact linearly decreases to zero. After 20 days, the signal no longer contributes to stage mapping.
When a signal with a Minimum Stage mapping fully decays, that minimum stage floor is also removed — the account is no longer guaranteed that stage from that signal alone.
As signals decay, accounts can naturally move backward through stages. This ensures Buying Stages remain dynamic and reflective of real-time behavior.
Decay is only available for time-based Company Signal attributes — not all signal types support this setting.
Buying Stages Reporting
Buying Stages include both a stage distribution view and a trend view. Both views are available on the Reporting page, which shows your full TAM across all ICPs.
Stage Distribution View
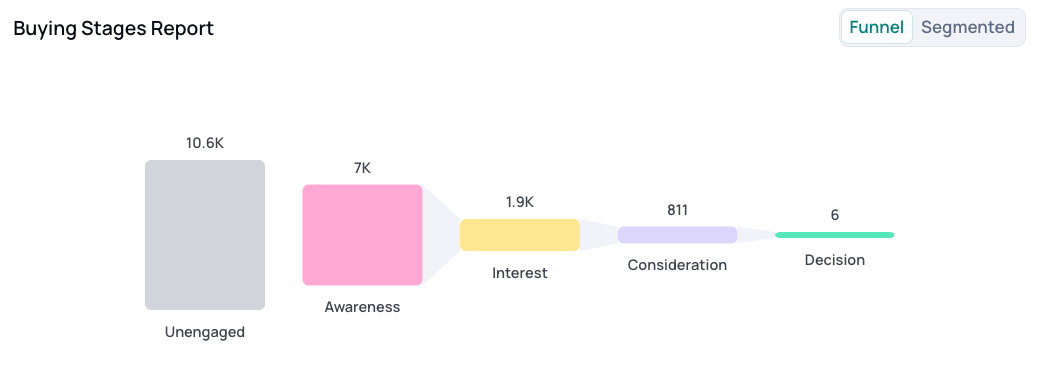
The funnel-style report shows total accounts in each stage with clear progression from Unengaged through Decision.
You can click into any stage to view accounts, expand stages to see the underlying list, and view each account's score and origin.
Accounts can be filtered by Net New (not yet in CRM) or Existing (already in CRM). This segmented view makes it easy to measure net-new TAM growth separately from re-engagement of existing accounts.

To view Buying Stages filtered by a specific ICP or segment, use the Top Rated Accounts view under ICP & Scoring — not the Reporting tab. The Reporting tab shows your entire TAM only.
Buying Stages Trends
The Buying Stages Trends chart shows how stage counts change over time. You can adjust timeframe, select a date range, and filter which stages to display.
This view helps teams:
- Measure awareness growth
- Track progression into Interest and Consideration
- Report on marketing impact over time
- Demonstrate movement across the funnel
