

Company Scoring helps you determine which companies are most worth reaching out to by assigning a score to every company and ranking Audiences with the highest scoring companies at the top.
A company's score is based on:
- How similar they are to your current customers — based on tools they use, how big they are, industry, etc.
- Whether the company and/or prospects show signs of interest — buying signals like funding, hiring, revive closed lost, past champions, etc.
NOTE: While users can edit signals, adjust scores, and upload new data, we recommend connecting with your UserGems CSE if it's your first time making updates to this page.
How Scoring Works
Think of scoring as a point system that flows through three levels:
(1) Signals and attributes earn points → (2) Points then add up to an account score → (3) Points become letter grades to make prioritization easier (A = better than average, B = average customer quality, C = slightly below, D = much worse)
Let's break down each step.
1. What Gets Scored
Every company's score is built from four key dimensions:
Company Similarity
How much the company looks like your current customers — based on ~600 attributes per company including tech stack, company size, hiring patterns, and more.
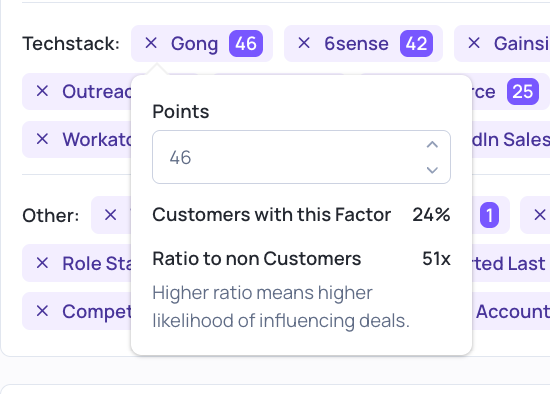
Example: If a quarter of your customers use Gong, a company that uses Gong will receive a significant score boost.
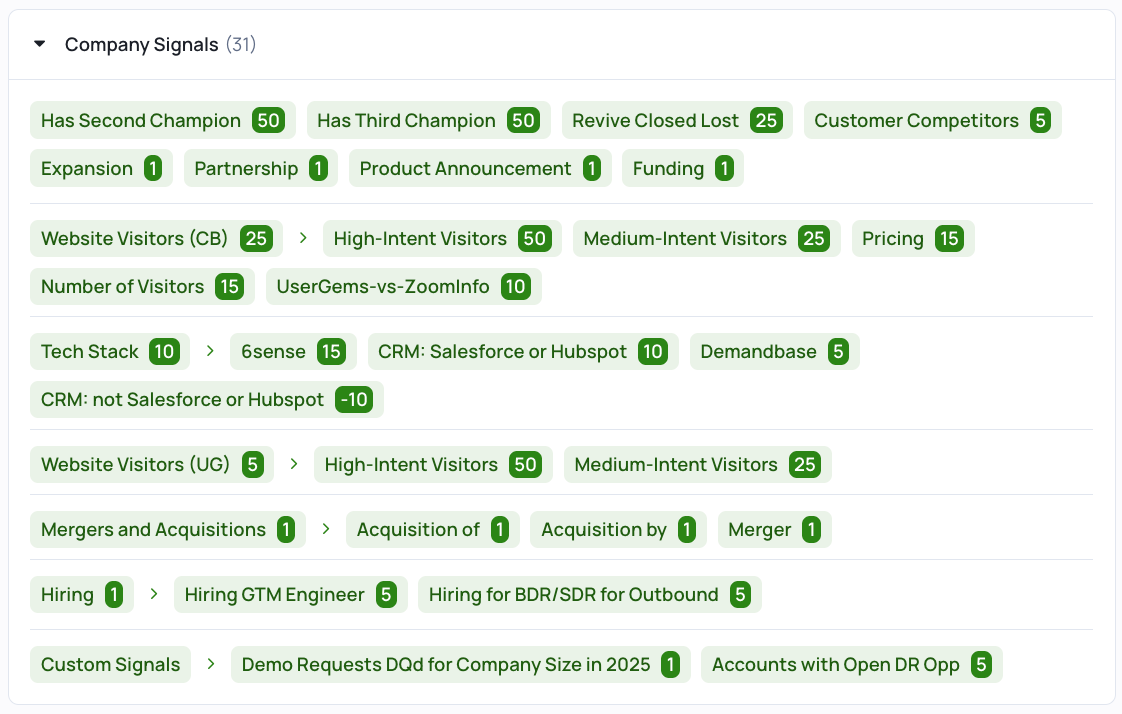
Company Signals
Signs that the company might be interested — like if they’ve recently evaluated you, just raised funding, or show intent. You can upload your own signals too.
Examples:
- Revive Closed Lost
- Hiring activity
- Relationship signals (e.g., presence of a past champion)
- Custom signals you upload (e.g., attended your event)
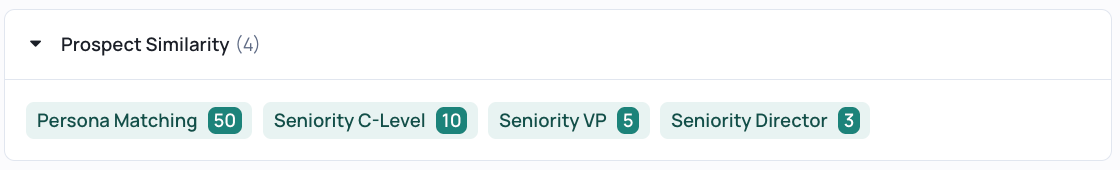
Prospect Similarity
How much the contacts at that company look like contacts in your current pipeline — evaluates how similar a contact is to prospects in your open opportunities.
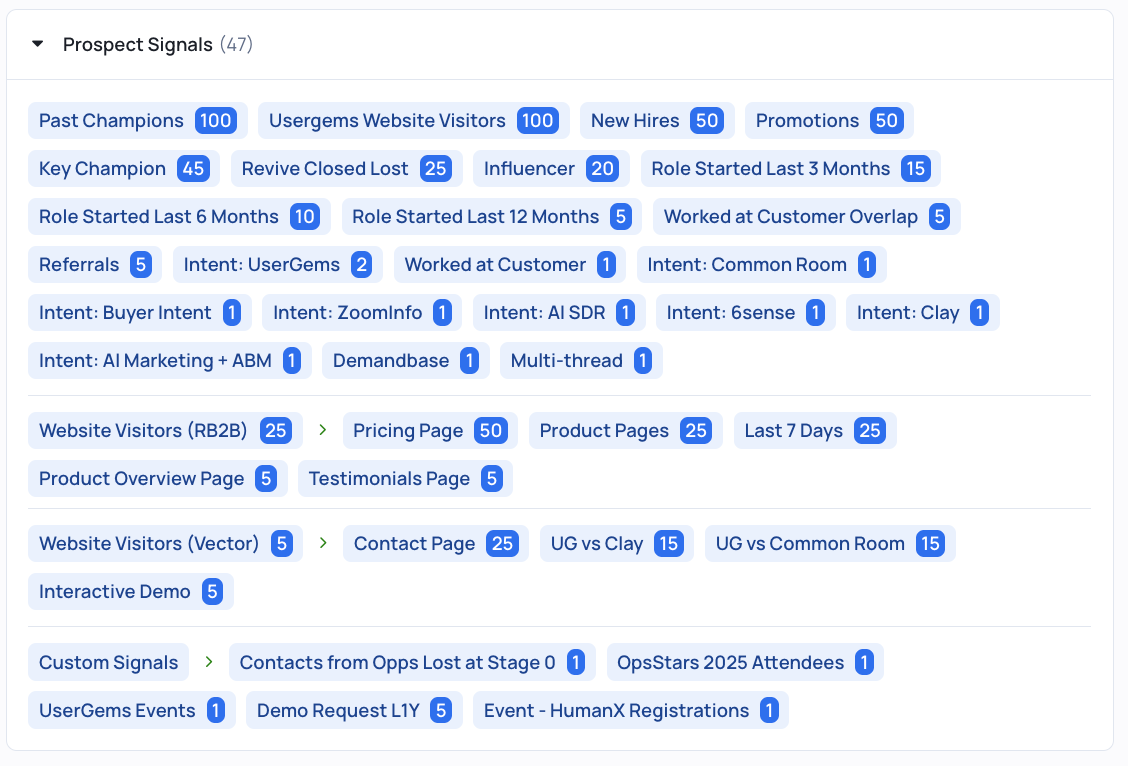
Prospect Signals
Signals from individual contacts that indicate interest or fit.
Examples:
- Past Champion or Recent Job Change
- Revive Closed Lost
- Website Visitor
- Requested Demo
2. How Points Work
Each signal and company attribute contributes points to an overall score. You'll see these point values directly on scoring chips in the product.
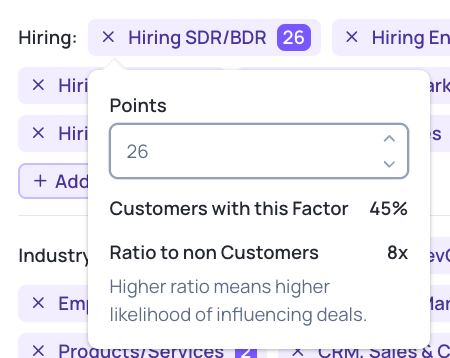
Point Range: -100 to +100
Most signals and attributes have positive points (0 to +100)
Examples:
- "Has Gong" +24 — 25% of your customers use Gong, so companies with this tool get 24 points
- "Past Champion" +100 — This contact was a champion at a previous company
Negative points (-100 to 0) are used to disqualify companies
Examples:
- "Incompatible CRM" -30 — Company uses a CRM that doesn't integrate with your product
How Points Add Up
For Prospects: The total score for a prospect is the sum of all their individual signal points.
For Companies/Accounts: The total account score is calculated as:
- All company-level points (similarity + signals)
- Plus the highest-scoring prospect within that company
This means if a company is a great fit but has no good prospects, it may not rank highly. Conversely, a single high-value prospect (like a Past Closed Won Contact ) can significantly boost a company's score.
3. From Points to Grades: The A-D System
Behind the scenes, we convert your point totals into a normalized 0-100 scale, then assign letter grades (A-D) based on how each account compares to your average customer account.
What Each Grade Means
A = Much better than your average customer account These accounts are your best opportunities and should be prioritized in outreach.
B = As good as your average customer account These accounts are solid fits and should be used in campaigns.
C = Slightly below average but still worth considering These accounts may be worth including in broader campaigns or nurture sequences.
D = Worse than your average customer accounts These accounts typically won't be used in targeted campaigns.
Why Grades Instead of Numbers?
Letter grades make it easier to quickly understand and act on scoring. Rather than trying to interpret whether a score of 64 is good or bad, you immediately know that a B-rated account is as good as your typical customer and worth pursuing.
How to Use Scoring
In Audiences
Companies are ranked by their overall score, with the highest-scoring companies appearing at the top. You'll see each company's grade (A-D) to help you quickly identify your best opportunities.
When you click into a company, you can see:
- Which signals and attributes contributed to their score
- The point value for each contributing factor
- Individual prospect scores within that company
Customizing Your Scoring
Adjusting Attributes and Signals
You can fine-tune which attributes and signals matter most for your business:
Inside your UserGems command center:
- Navigate to the "ICP & Scoring" tab in the left sidebar
- Select the “Scoring” tab in the upper navigation bar
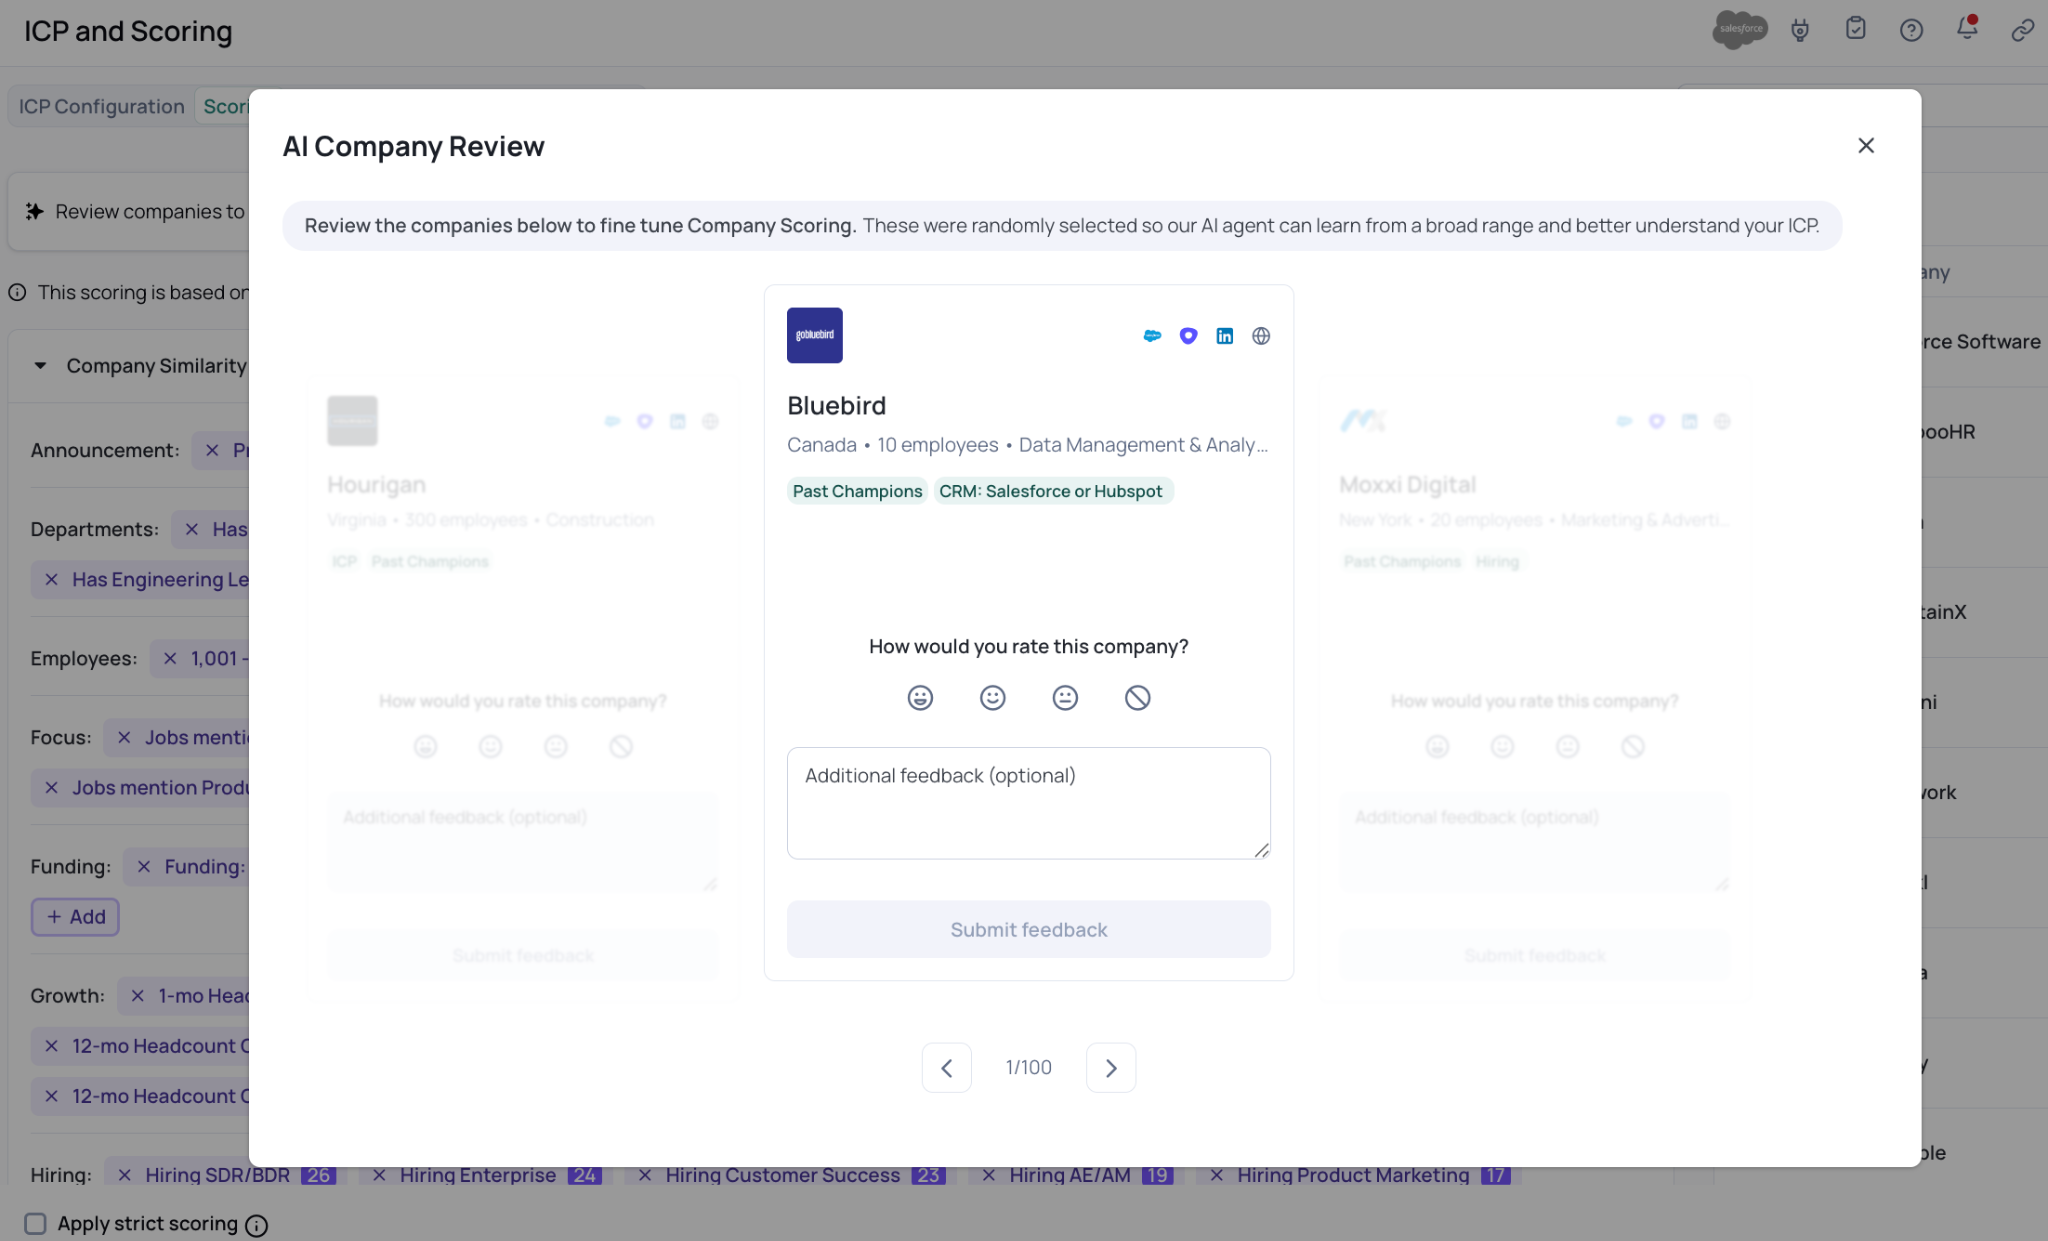
- Select “Review Companies” (upper right corner)
- Rate companies as great, good, okay, or exclude them
- For exclusions, you'll need to submit feedback before moving on
Note: Companies in the AI training page will consist of both "bad" fit companies and customers. This helps you rank and train your AI model. We highly recommend you review multiple as providing only a few will not be enough to change the model.
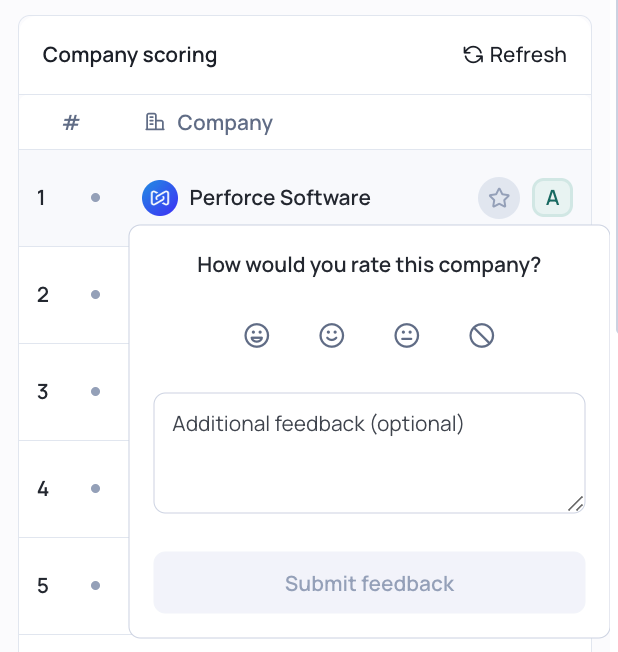
From Audiences: Give feedback directly on companies by clicking the star icon to view and adjust ratings.
Best Practices
✓ Focus on A and B accounts first — These represent your best opportunities and should be prioritized in outreach campaigns
✓ Use C accounts strategically — Consider these for broader nurture campaigns or lower-touch sequences
✓ Review scoring regularly — As your customer base evolves, your ideal customer profile may shift. Revisit your scoring model quarterly
✓ Connect with your CSM before major changes — If you're planning significant updates to signals or scoring, your CSM can help ensure changes align with your goals
Technical Notes
Behind the Scenes: Normalized Scoring
While you see letter grades (A-D) in the product, here's what happens behind the scenes:
- Point totals are calculated for each account based on all contributing signals and attributes
- Scores are normalized to a 0-100 scale by comparing each account to others in your target list
- The average account score becomes the baseline — This average is labeled as a "B" grade
- Letter grades are assigned based on how far above or below the average each account falls
This approach ensures that your scoring is always calibrated to your actual customer base, not an arbitrary scale.
Why This Matters
By anchoring grades to your average customer account (B), we ensure that:
- A "B" grade always represents a good, campaign-worthy account
- You're not misled by outliers or extreme high scores
- Scoring remains consistent as you add more data over time