

Marketing Reporting shows where every account in your TAM sits in the buying journey, how accounts move between stages, and which ones turn into pipeline. It also shows how your LinkedIn ads affect that movement.
⭐ Marketing Reporting runs on Buying Stages and the LinkedIn Ads section also requires Ad Audience Sync. Contact your CSM today to learn more.
Why it matters
- Show your board the impact. You can show accounts moving from Awareness toward Decision over time, not just impressions and clicks.
- Prove your TAM is growing. See which accounts in each stage were already in your CRM and which ones UserGems found for you.
- Find where accounts get stuck. Stage transitions show which stages accounts move forward from and which ones they fall back from.
- Connect stages to pipeline. See which stage accounts were in when an opportunity opened.
- Defend your ad spend. Compare how accounts that saw your LinkedIn ads progress against accounts that didn't.
📝 New to Buying Stages? Start with the Buying Stages article. It covers how stages are calculated and how to map your signals.
Where to find it
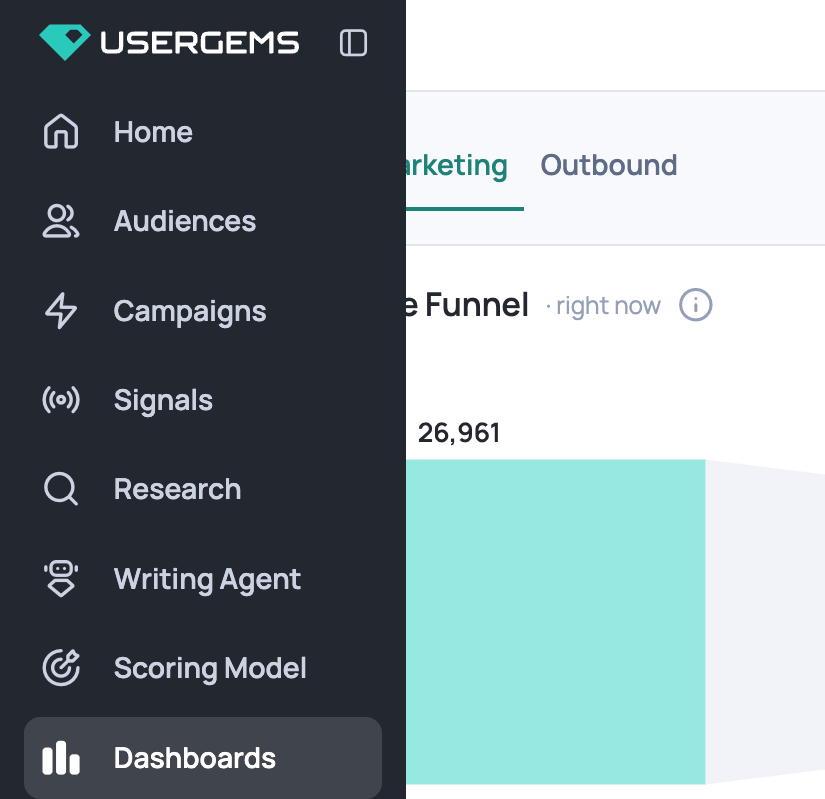
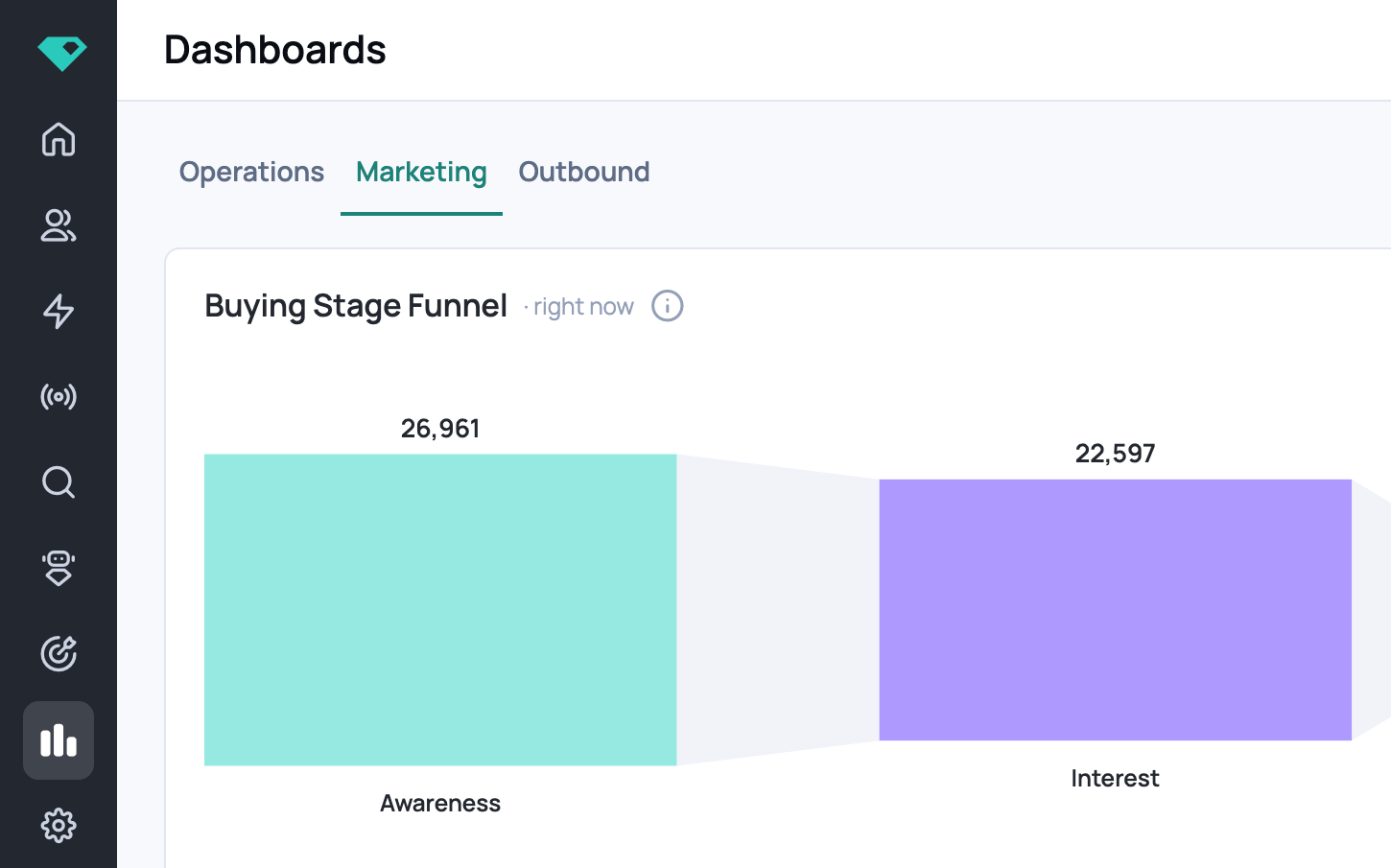
Go to Dashboards in the left-hand navigation, then click the Marketing tab.
Buying Stage Reports
The Marketing tab has four Buying Stage reports. The first three share the same filters.

Standard filters
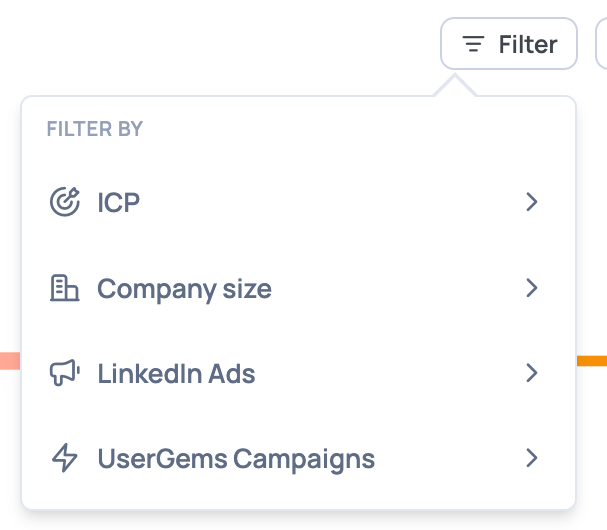
Click Filter on the Buying Stage Funnel, Stage transitions, or Accounts entering Open Opp report to narrow the view by:
- ICP: only accounts that match a specific ICP
- Company size: an employee range, like 1,001–5,000
- LinkedIn Ads:
- Saw ads: only accounts that saw at least one of your LinkedIn ads
- No ads: only accounts that didn't see any
- Split: saw ads vs no ads: all accounts in each stage, split by the percentage that saw your ads vs. didn't
- UserGems Campaigns: only accounts in a specific UserGems campaign
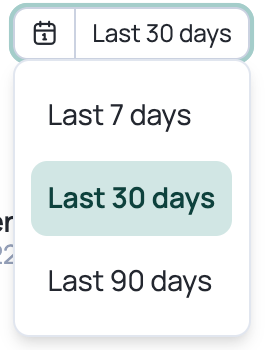
Stage transitions and Accounts entering Open Opp also have a timeframe selector: Last 7, 30, or 90 days.
Buying Stage Funnel
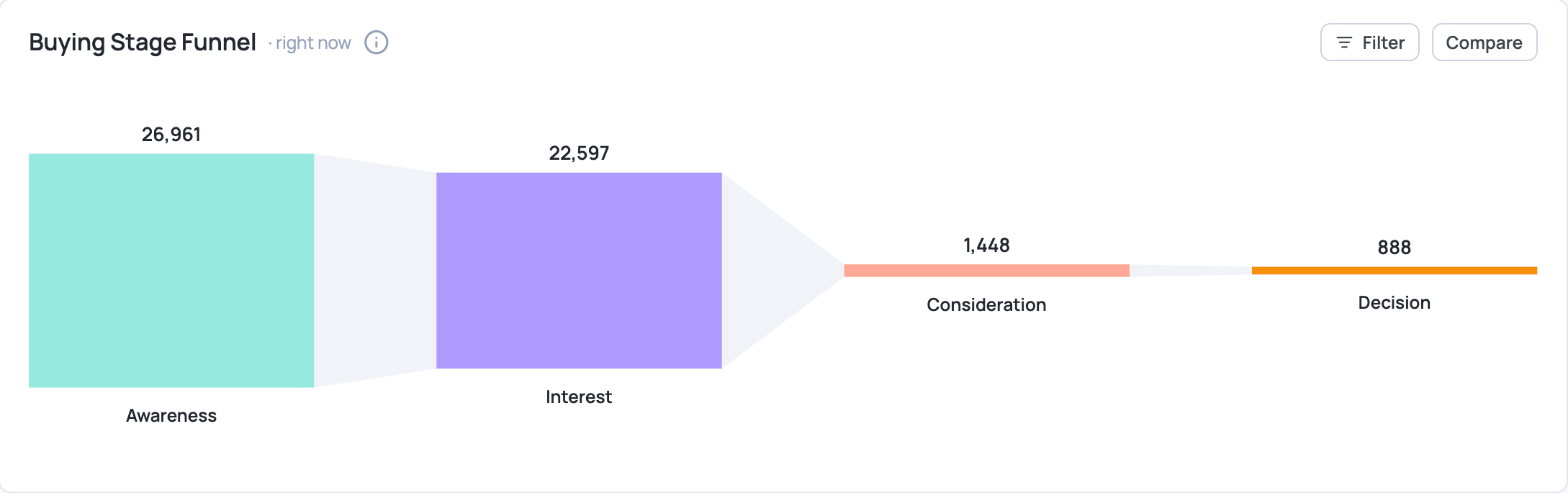
The funnel shows how many accounts are in each stage (Awareness, Interest, Consideration, Decision) right now.
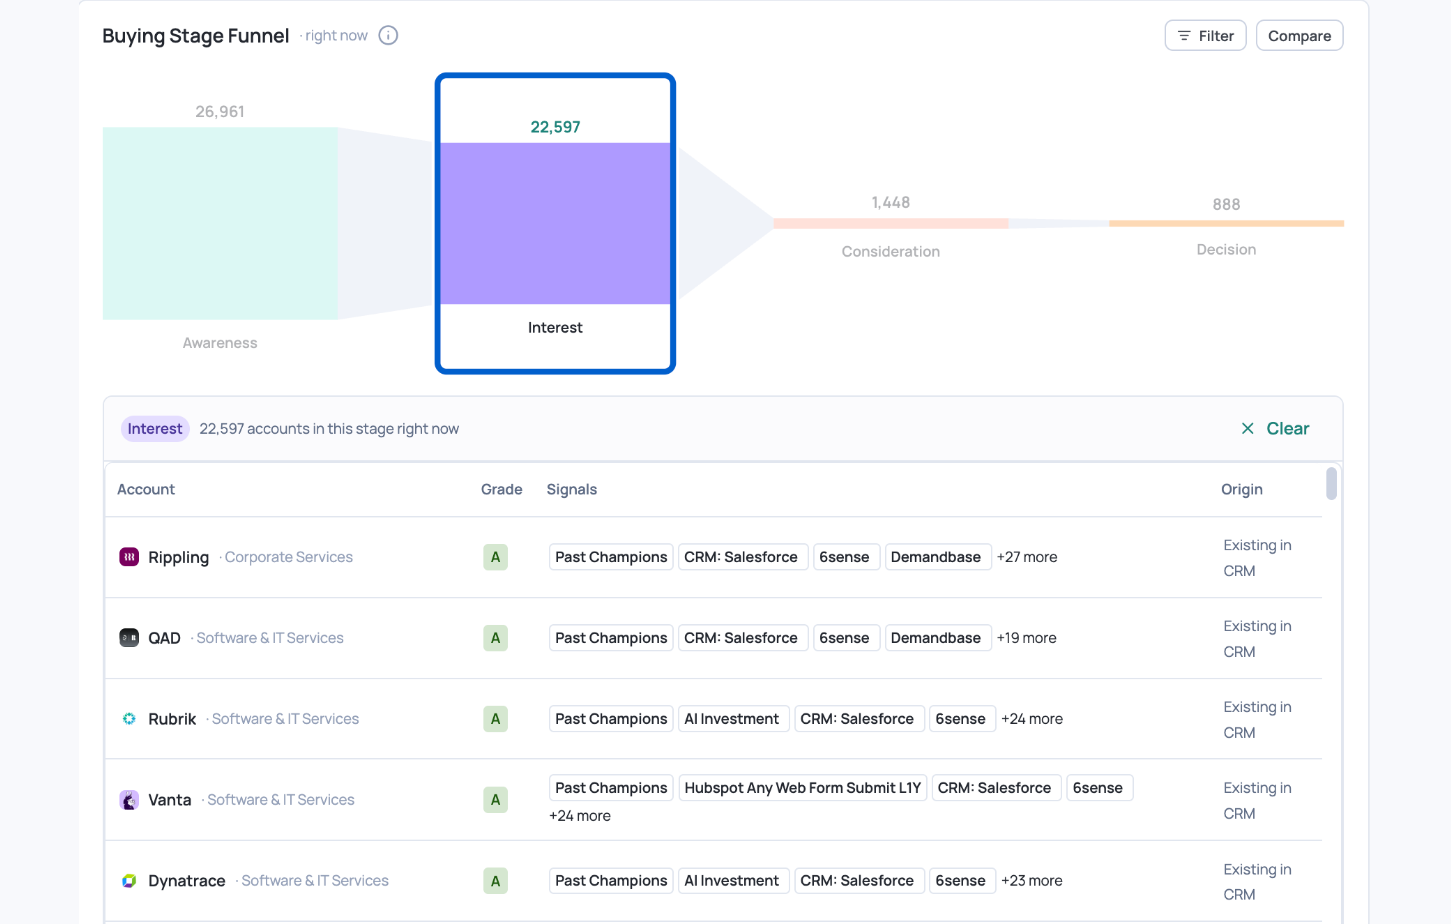
Drill into a stage. Click any stage to see every account currently in it, along with:
- Grade: the account's A–D score
- Signals: the active signals on the account
- Origin: whether the account was Existing in CRM or found by UserGems
Compare two dates. Click Compare and pick two dates. Each stage then shows the count for both dates and the percentage change between them. For example, "+104%" on Consideration means there are 104% more accounts in Consideration on the later date than on the earlier one.
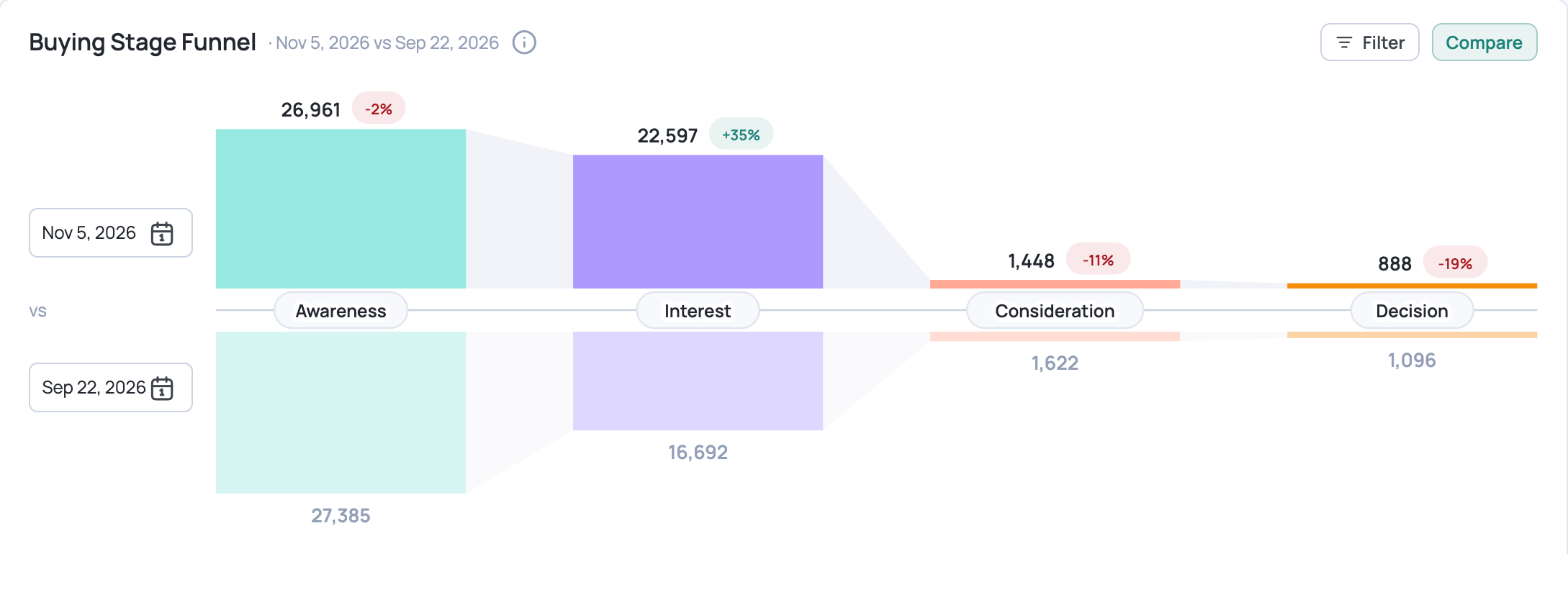
📝 In Compare mode, clicking a stage lists the accounts in that stage today, not the accounts that were there on the earlier date.
⚠️ If you pick a date from before Buying Stages was turned on for your account, the counts will show 0 or N/A.
Stage transitions
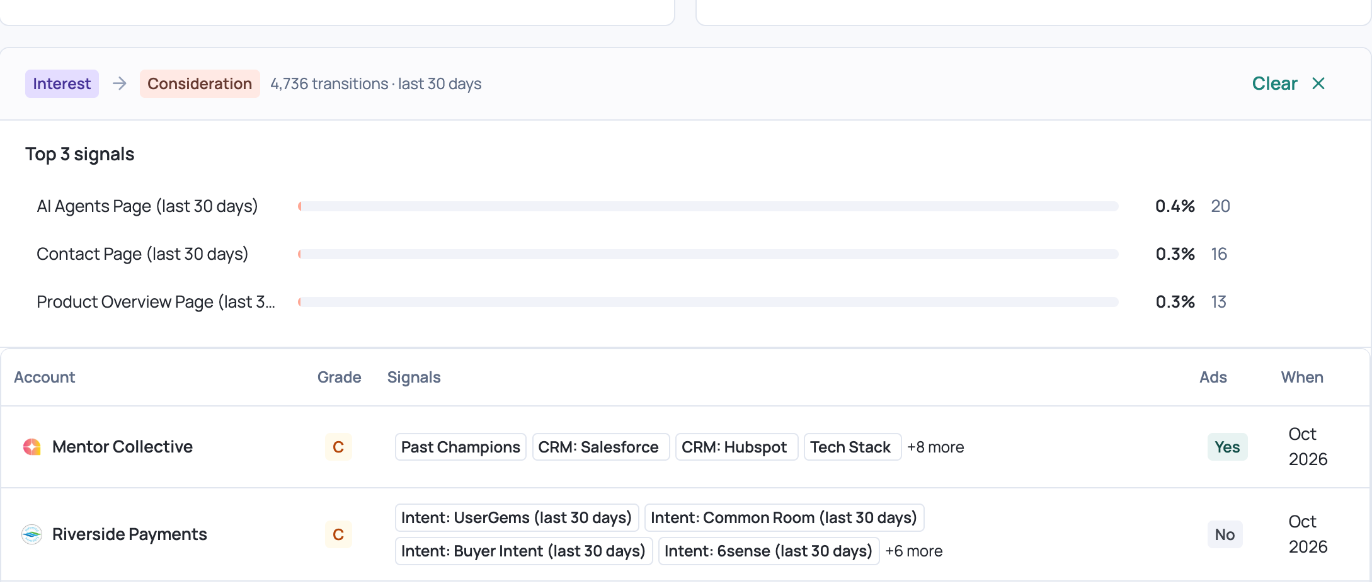
Stage transitions show how accounts moved between stages over the selected timeframe. The left side shows the stage each account started in, and the right side shows where it ended up. Hover over a flow to see how many accounts took that path.
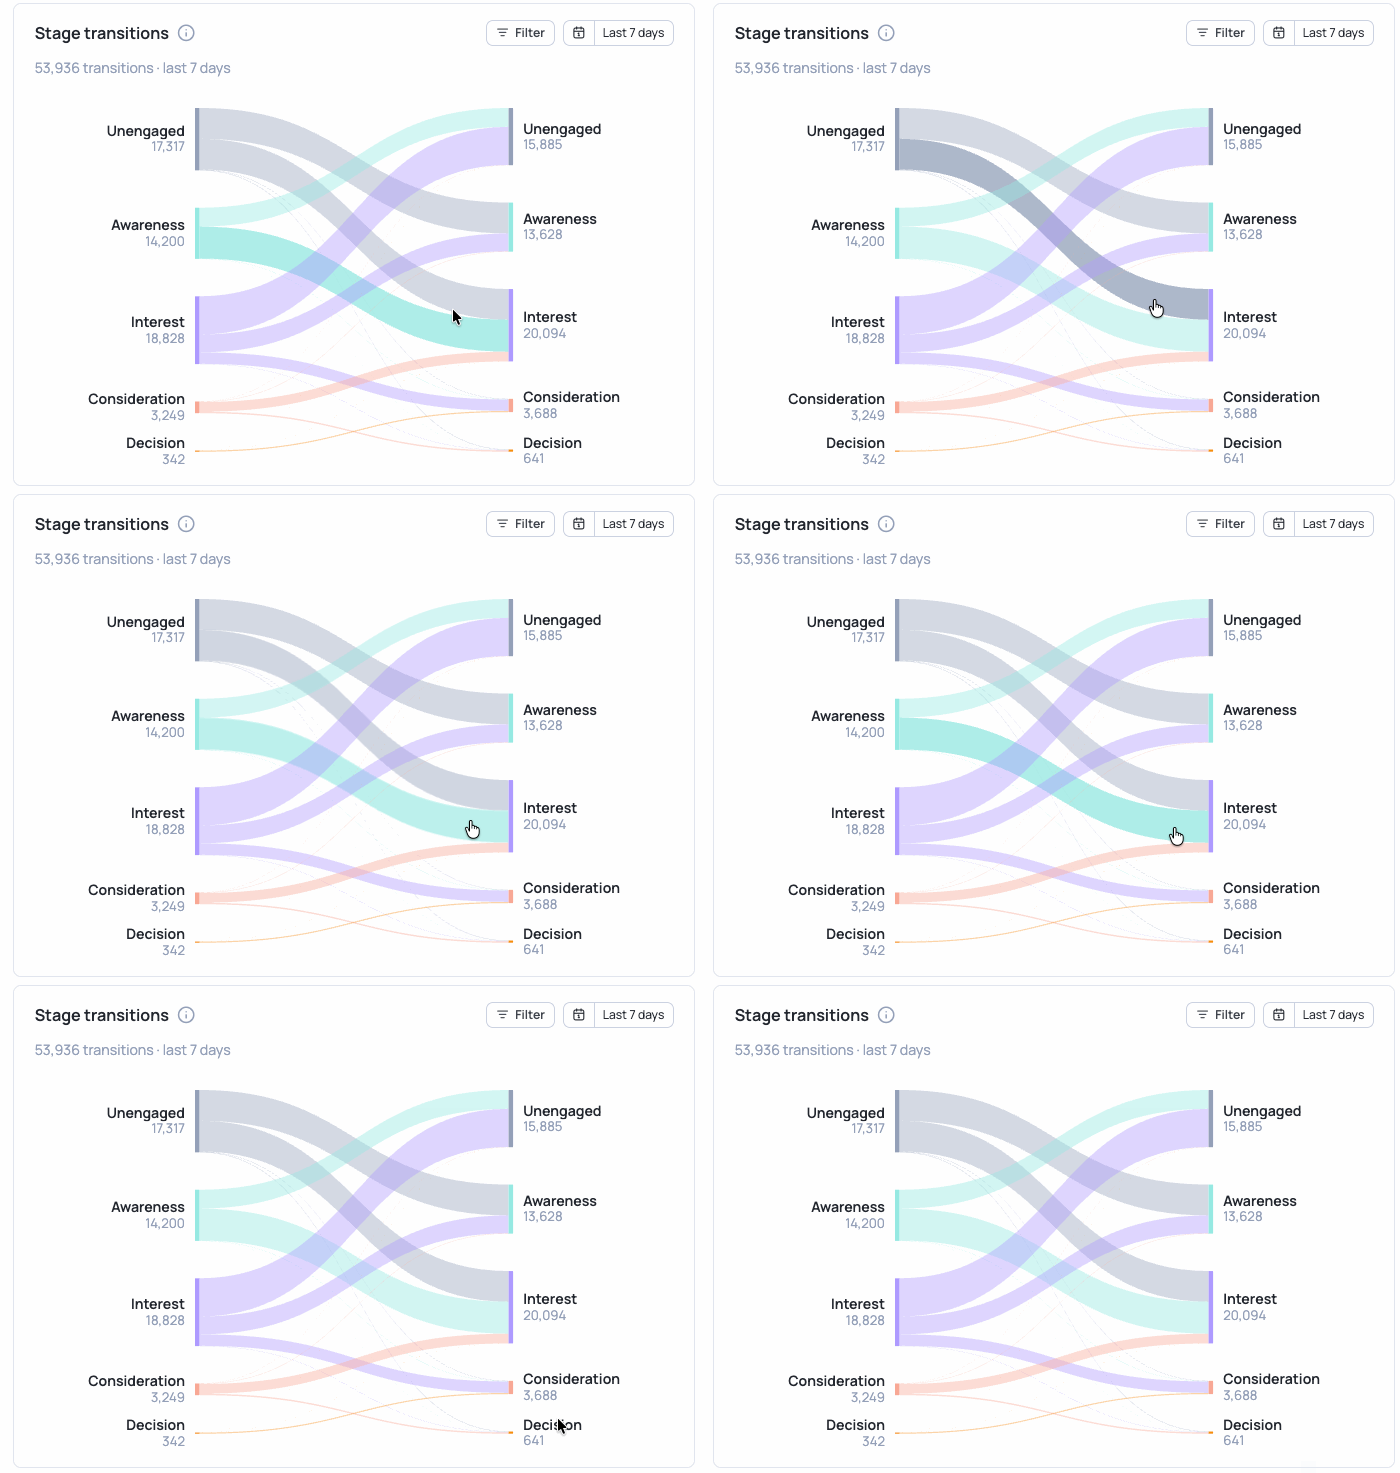
Click a flow to see the accounts that made that move. For example, clicking the Interest → Consideration flow lists every account that moved from Interest to Consideration, with its Grade, whether it saw your LinkedIn Ads, and When the move happened.
Accounts entering Open Opp
This report shows which stage accounts were in when an opportunity was opened during the selected timeframe. Hover over a flow to see the count, like "Consideration to Open Opp: 54."
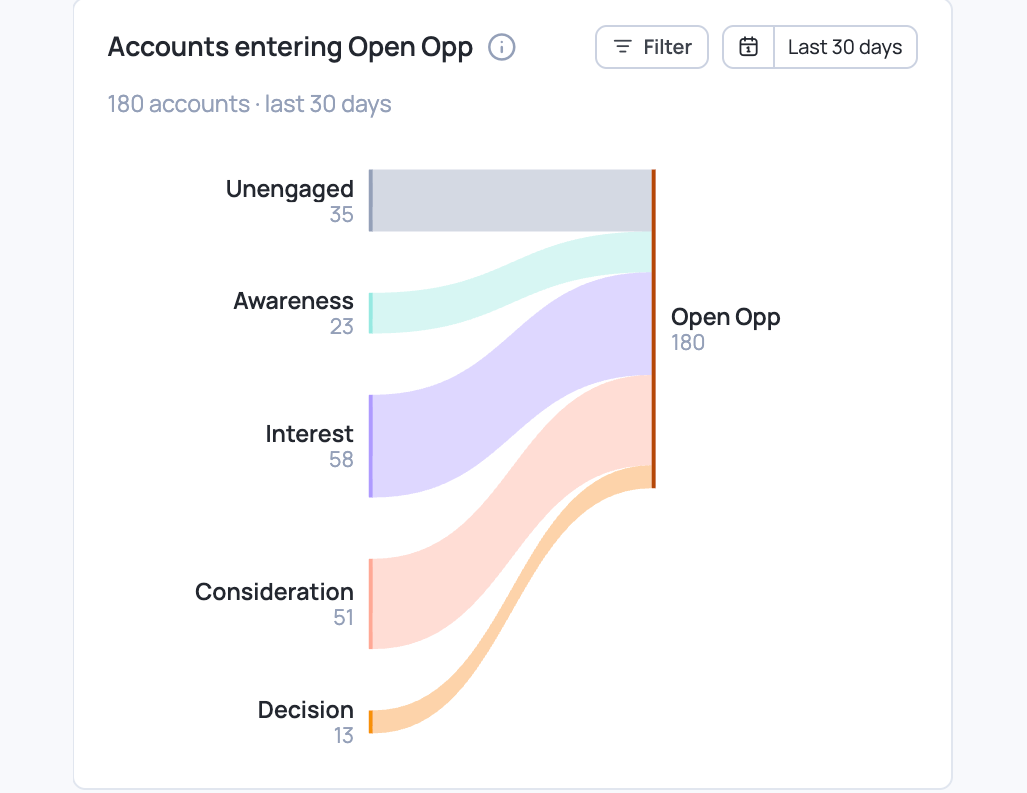
📝 Seeing opps that came from Unengaged accounts? It means UserGems didn't track any marketing engagement for those accounts before the opp opened. That's common for outbound-sourced pipeline. It can also be a sign that you should connect more first-party signals, like web forms, events, or email engagement.
Buying stages over time
This chart shows how many accounts were in each stage over time, across your full TAM. Hover over any point to see the stage breakdown for that date.
You can adjust:
- Range: Current quarter, Last quarter, Last 6 months, Last 12 months
- Timeframe: Weekly, Monthly, Quarterly
- Filter: by Campaigns or by Buying Stages
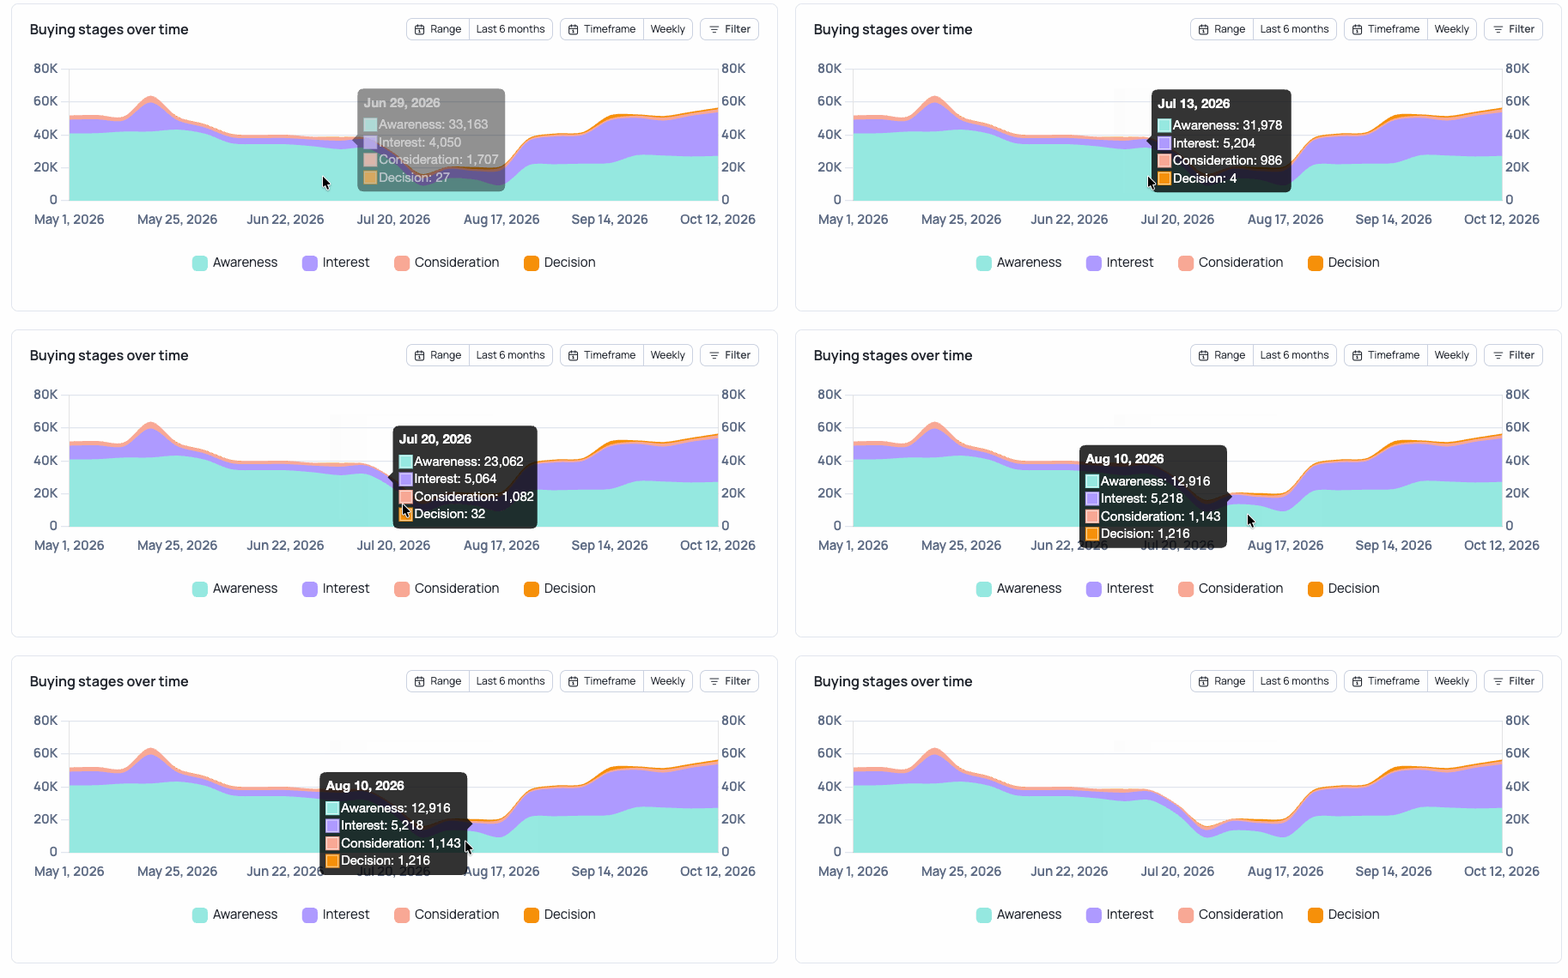
📝 This chart always shows your full TAM. ICP and Company size filters aren't available here.
💡 In a healthy funnel, Awareness shrinks over time as more accounts move into Interest, Consideration, and Decision.
Activity Timeline
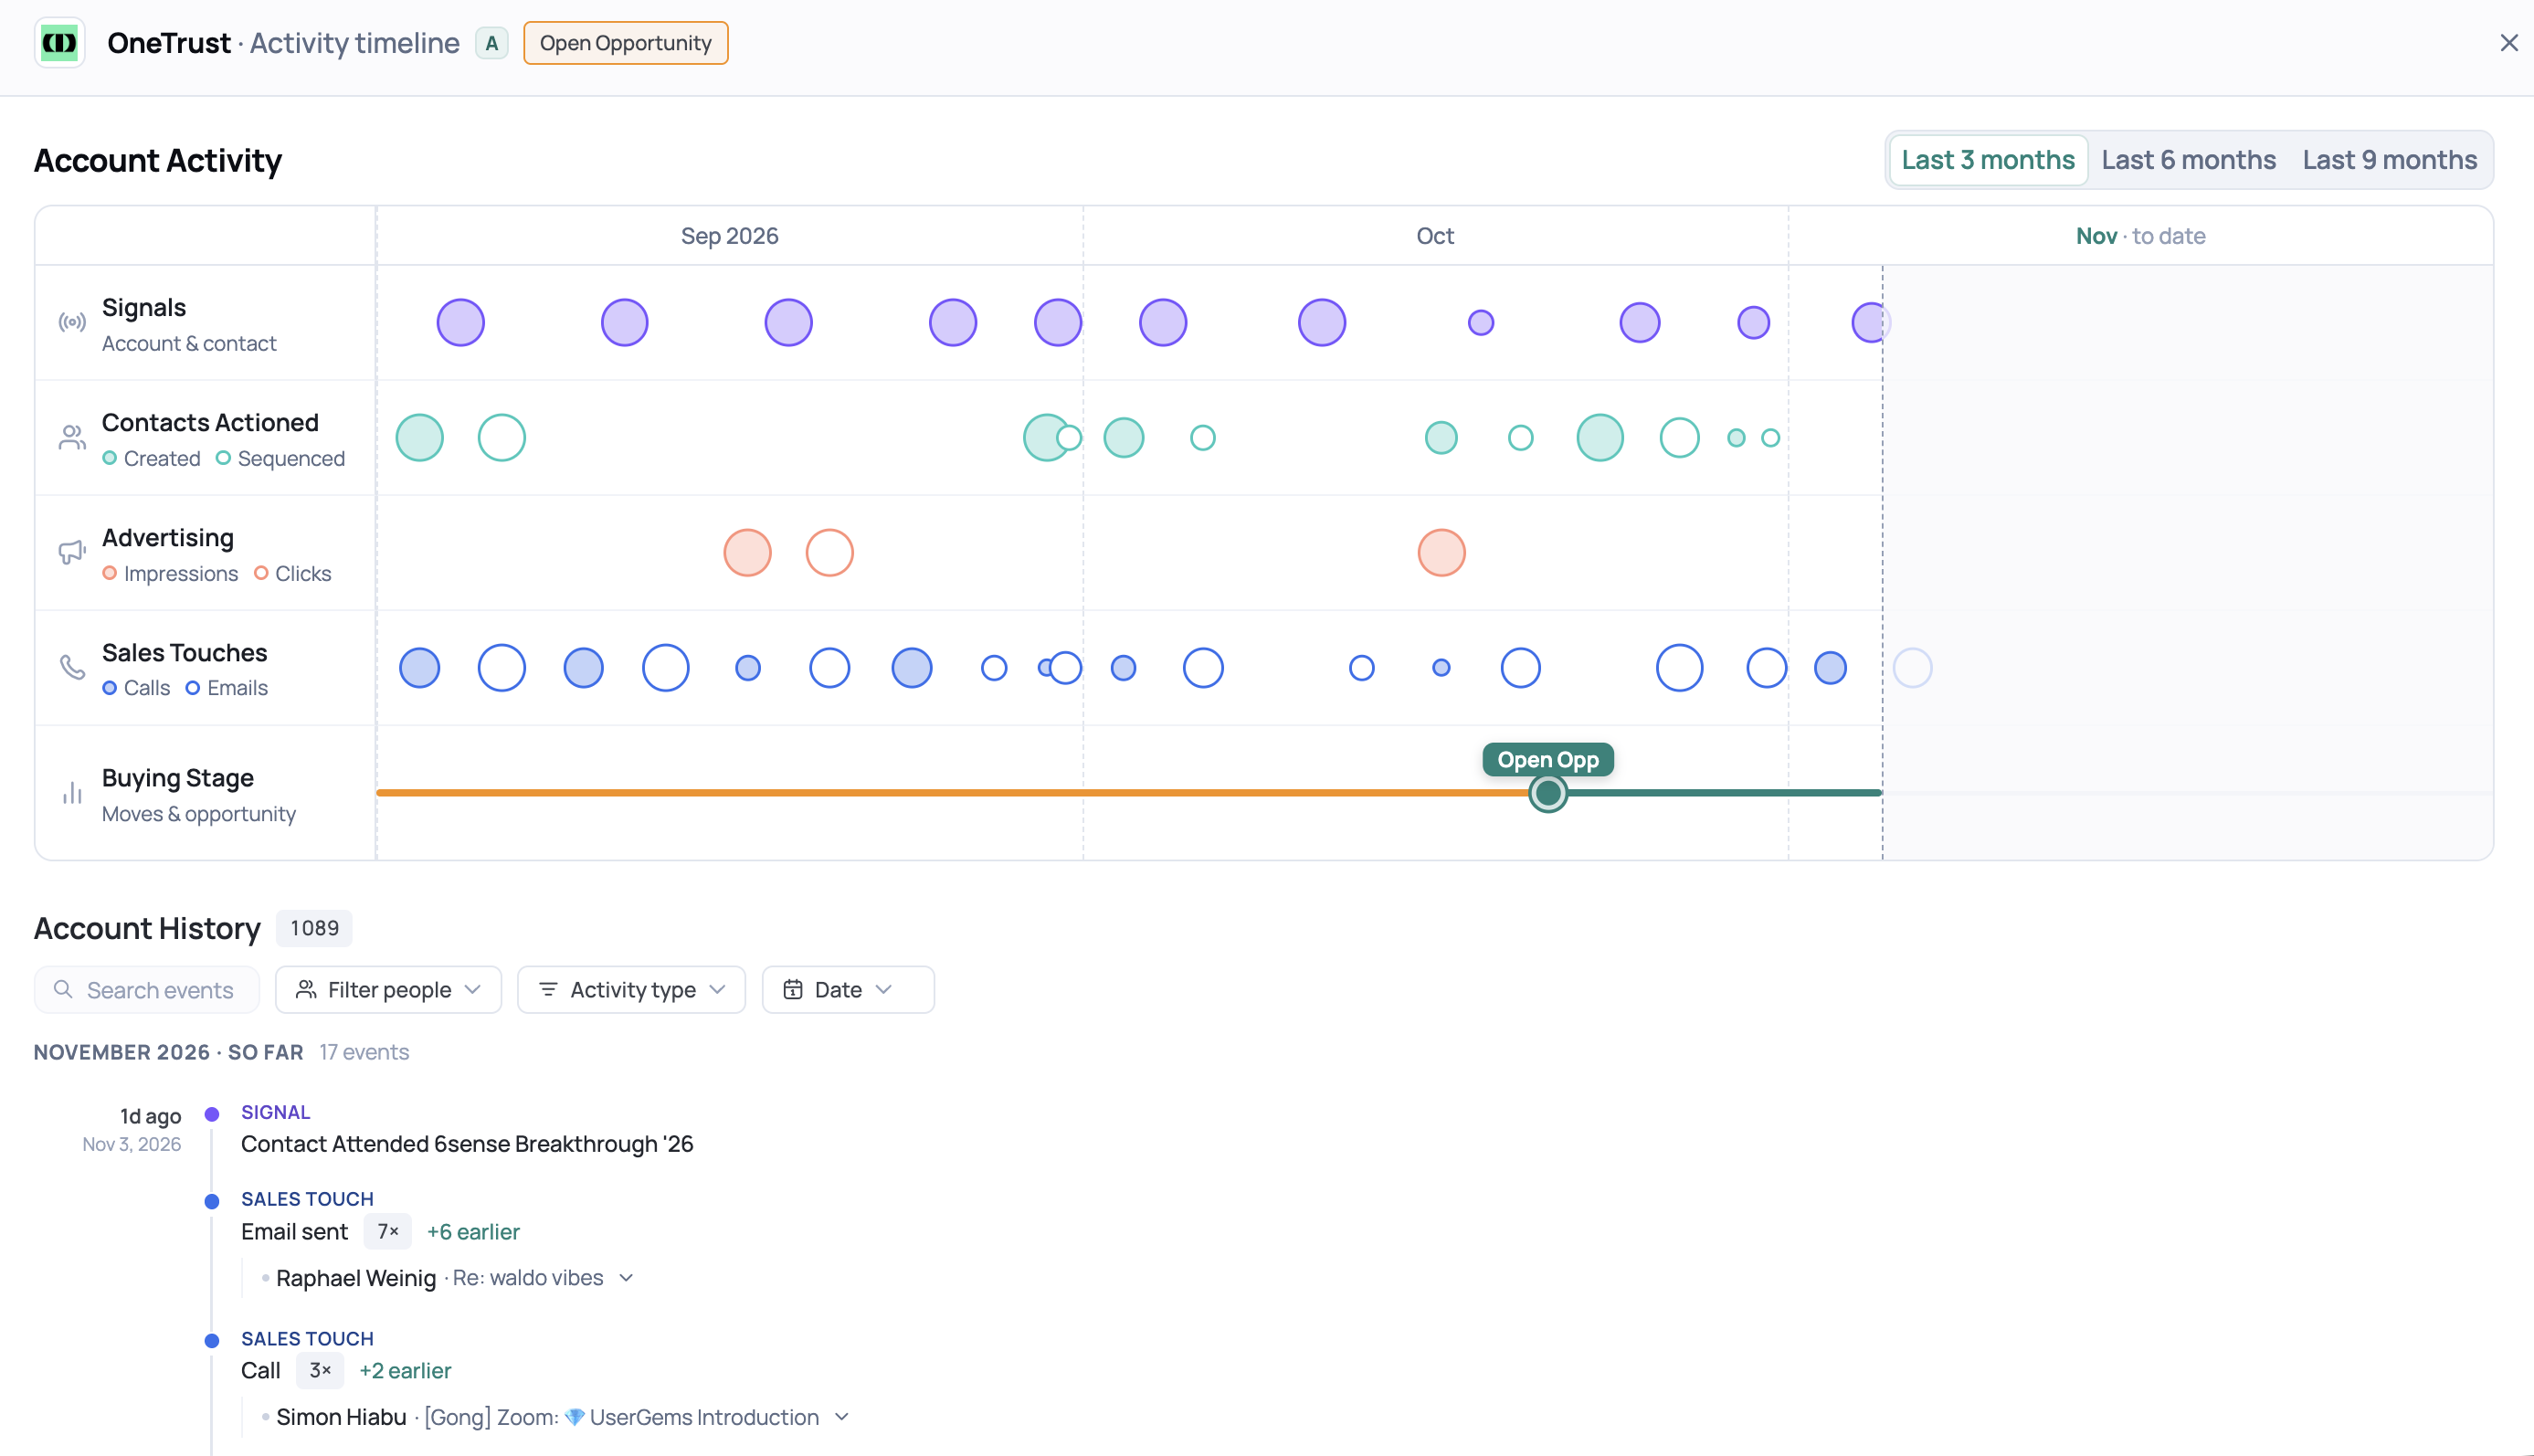
The Activity Timeline shows everything that happened at an account in one place: signals, outreach, ads, and how the account moved through its buying stages.
To open it, click a flow in Accounts entering Open Opp, then click any account in the list. A side panel opens with that account's journey over the last 3 months.
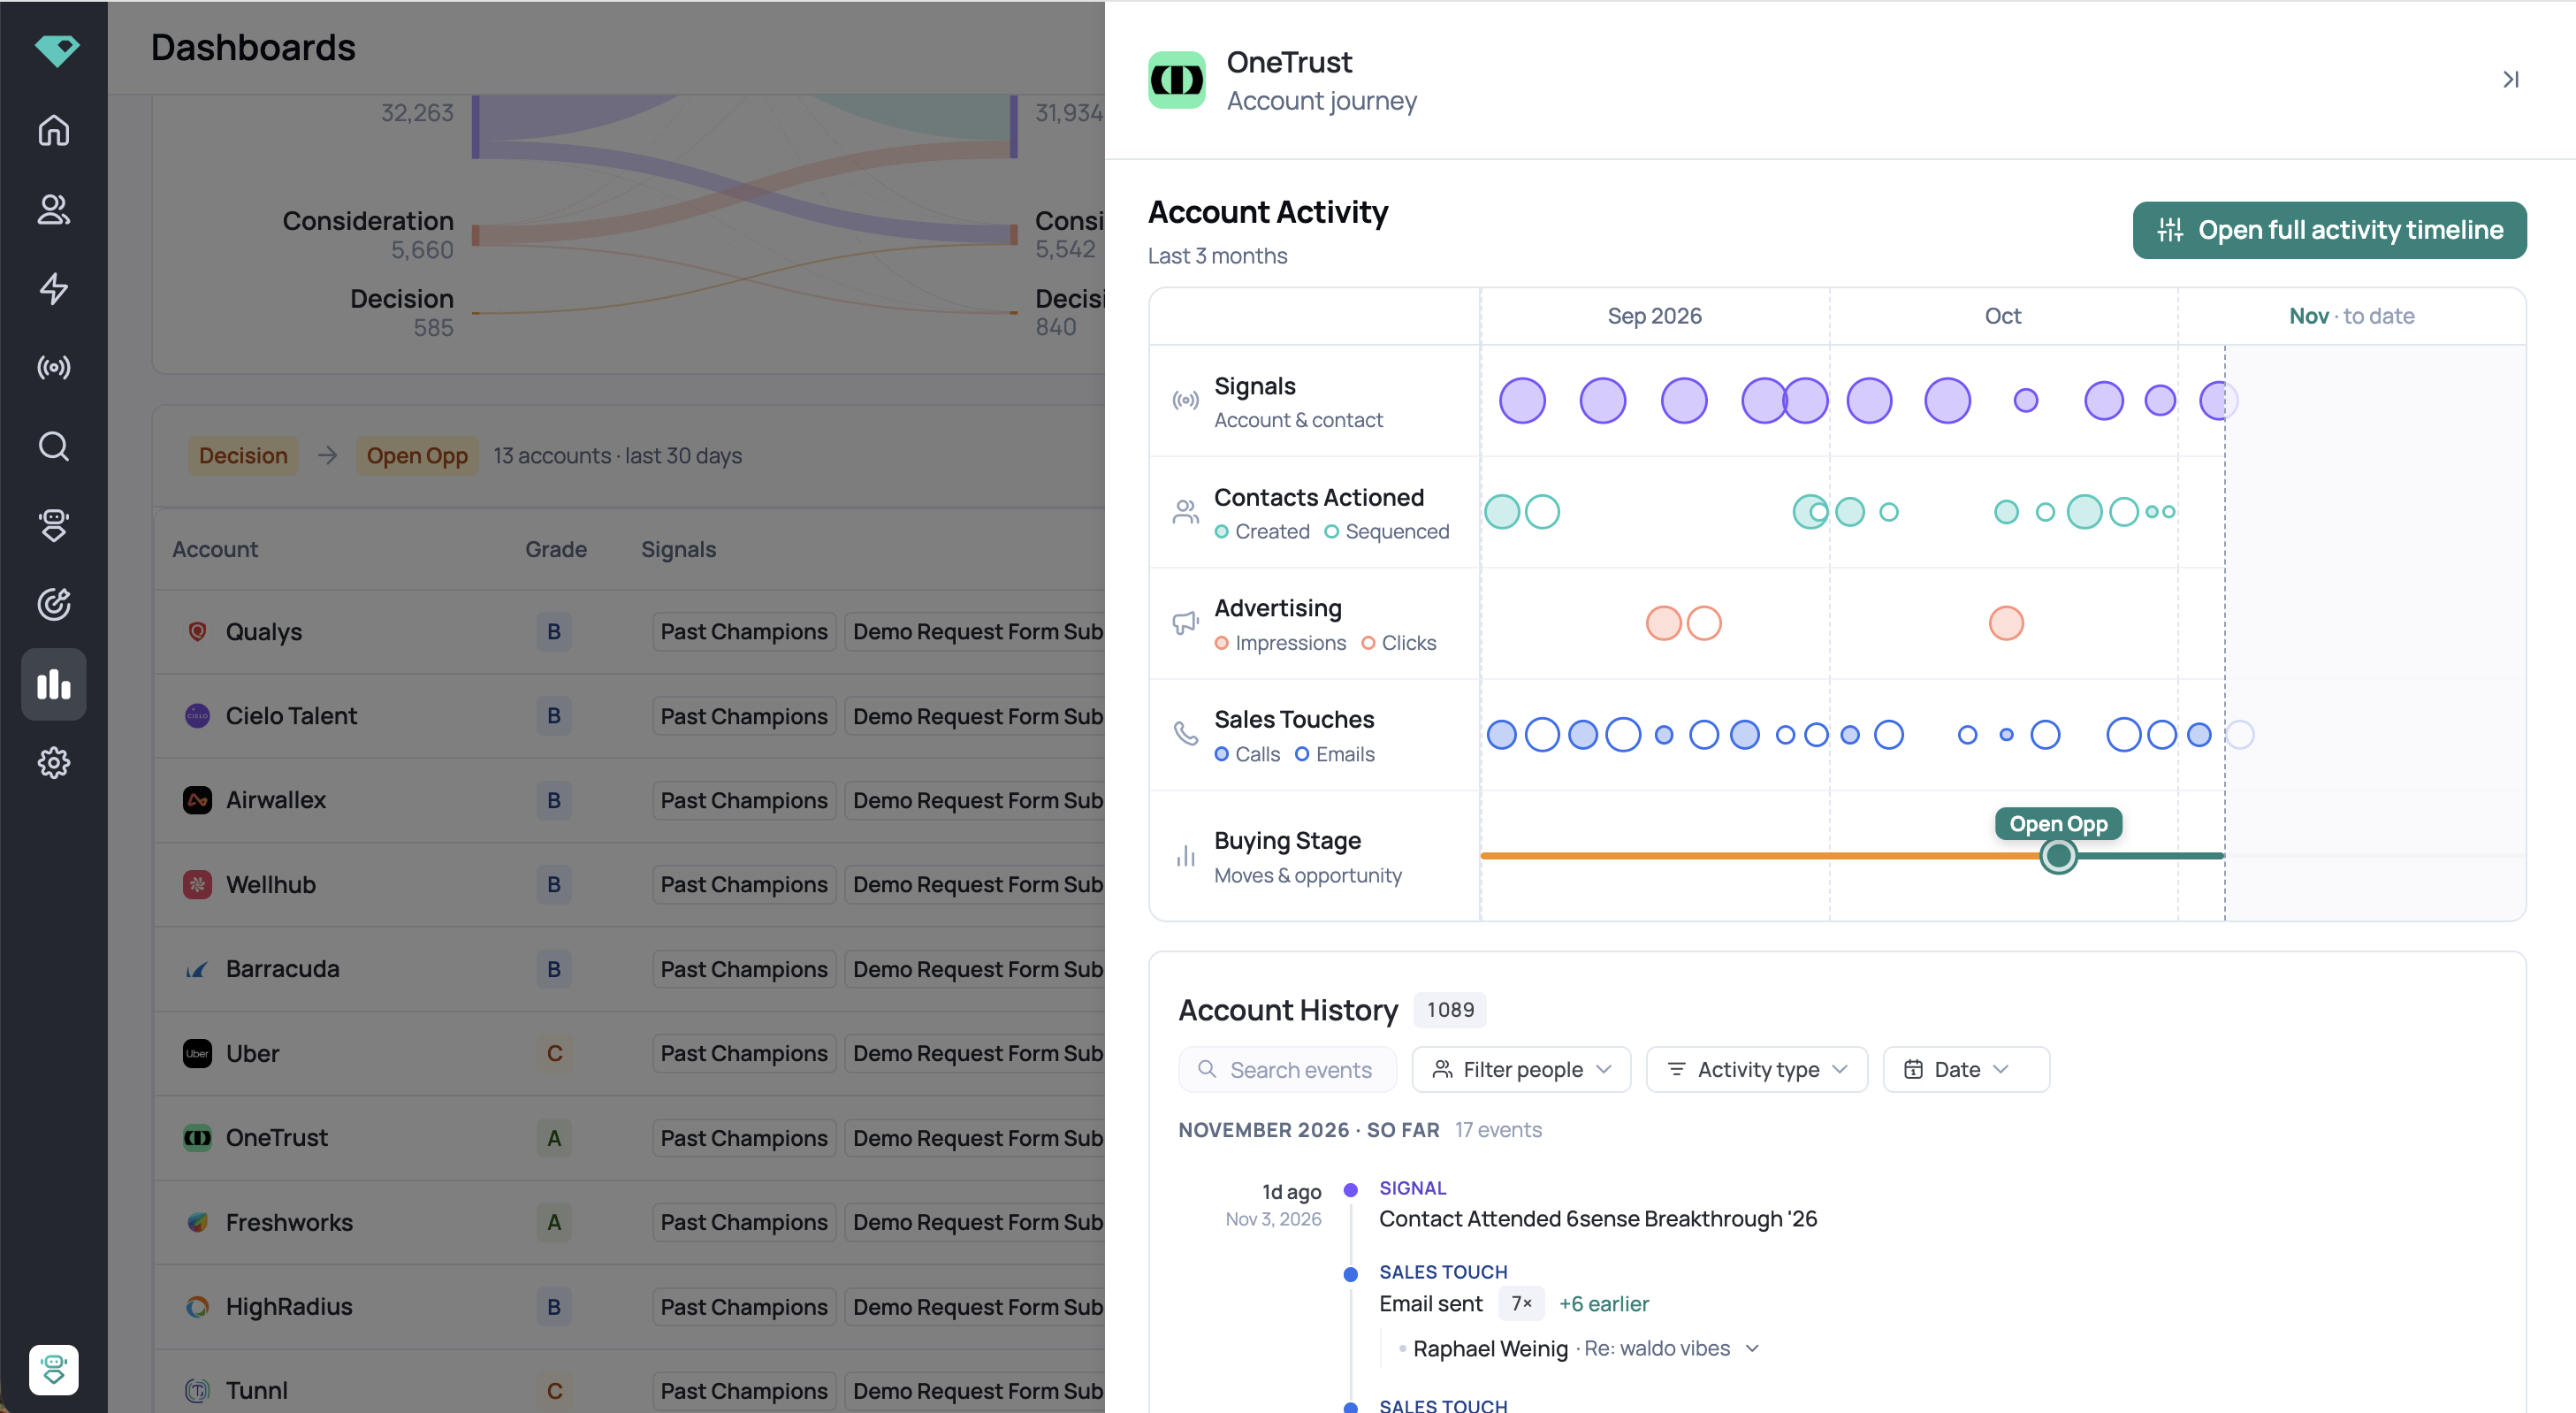
Click Open full activity timeline in the upper right of the panel to see the full view. From here you can switch between the last 3, 6, or 9 months.
Account Activity
Each row tracks a different kind of activity across the timeline:
- Signals: account- and contact-level signals
- Contacts Actioned: contacts that were created or added to a sequence
- Advertising: LinkedIn ad impressions and clicks
- Sales Touches: calls and emails
- Buying Stage: each time the account changed stages, plus when an opportunity opened
Hover over any dot to see the details. For example, hovering over an Advertising dot shows the number of clicks that month and which campaigns they came from.
💡 Look at what happened right before the Open Opp marker on the Buying Stage row. It shows which activity came just before the account turned into pipeline.
Account History
Below the chart, Account History lists every event at the account, newest first, grouped by month. Repeated activity is grouped together. For example, "Email sent 7x" collapses seven emails into one line that you can expand.
To narrow the list, search events or filter by:
- People: only activity from specific contacts at the account
- Activity type: for example, only signals or only sales touches
- Date: a specific time range

LinkedIn Ads Impact by Campaign
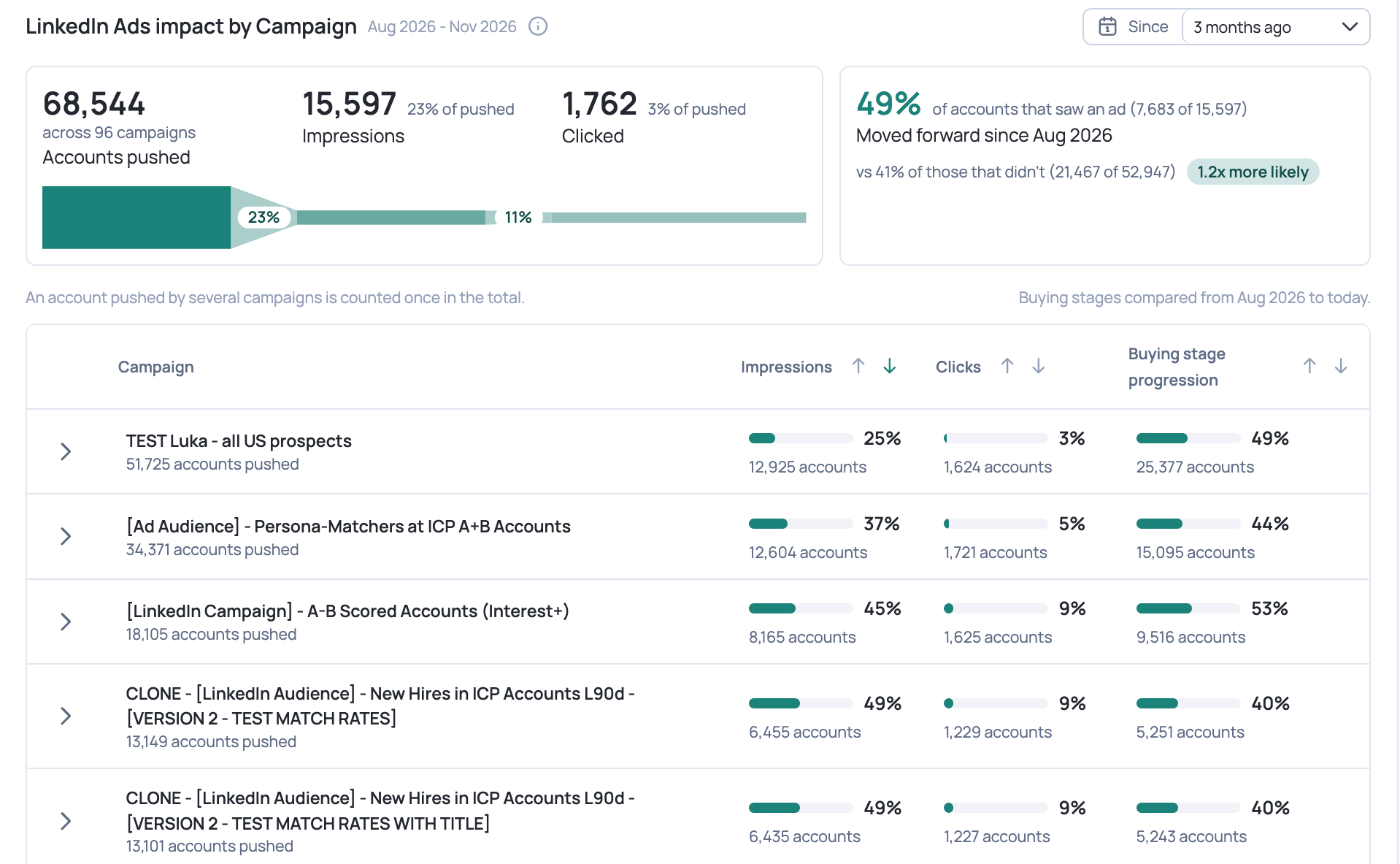
This section shows how many accounts your LinkedIn ad campaigns reached and whether those accounts moved forward in their buying stages.
⭐ Requires the Ad Audience Sync add-on and a connected LinkedIn Ads account.
Use Since to choose the period: Current month, 1 month ago, 3 months ago, 6 months ago, or 1 year ago.
Summary metrics
- Accounts pushed: unique accounts successfully synced to LinkedIn across all your campaigns
- Impressions: accounts pushed that had at least one paid LinkedIn ad impression in the selected period
- Clicked: accounts pushed that had both a paid impression and a paid click in the selected period
📝 An account pushed by more than one campaign is only counted once in the totals.
Buying stage progression
The column on the right compares how many accounts that saw an ad moved forward a stage with how many accounts that didn't see an ad. For example: "39% of accounts that saw an ad moved forward vs. 22% of those that didn't (1.8x more likely)." Stages are compared from the start of the selected period to today.
Campaign table
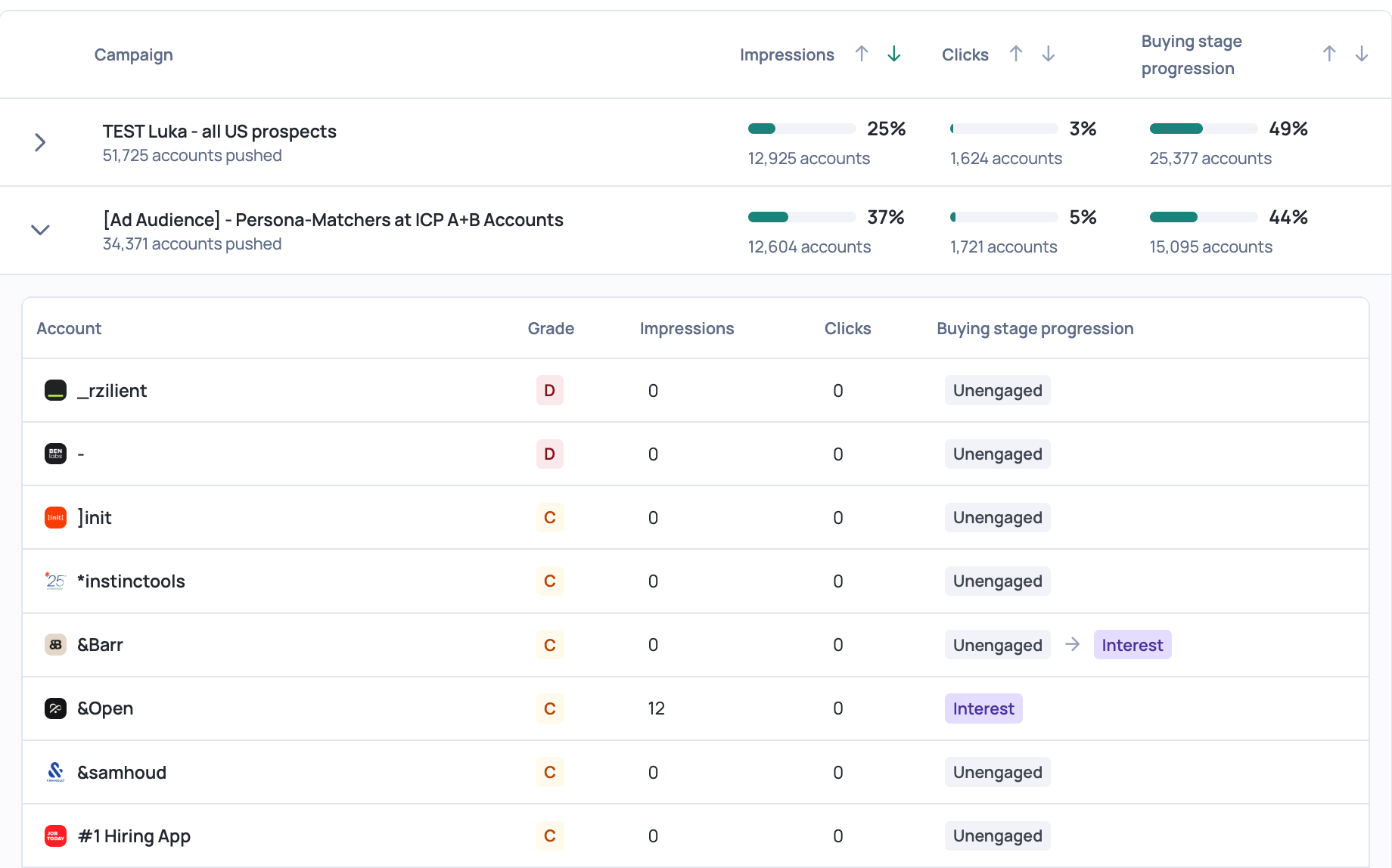
Each campaign shows how many accounts it pushed, plus the share of those accounts with impressions, with clicks, and with buying stage progression. Click the arrow next to a campaign to see the accounts in it, with each account's grade, impressions, clicks, and stage movement (for example, Unengaged → Interest).
FAQs
Does an account in Decision mean it's ready to buy?
No. Decision means the account is showing high-intent activity on your site, like visiting your pricing or demo pages. It's close to requesting a demo, not to signing a contract.
Why does my funnel have far more accounts in Awareness than in Decision?
That's expected. The funnel is naturally heavy at the top and thin toward Decision.
Why don't I see LinkedIn Ads data?
LinkedIn Ads reporting needs the Ad Audience Sync add-on and a connected LinkedIn Ads account. Reach out to your CSM to set it up.